
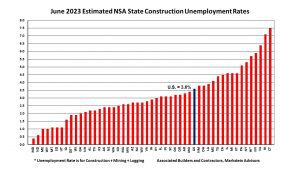
The not seasonally adjusted national construction unemployment rate was 0.1% lower in June 2023 from a year ago, down from 3.7% to 3.6%. According to a state-by-state analysis of U.S. Bureau of Labor Statistics data released today by Associated Builders and Contractors, 15 states had lower unemployment rates over the same period, seven were unchanged and 28 states were higher. All states posted an unemployment rate lower than 8%.
National NSA payroll construction employment was 199,000 higher than in June 2022. From February 2022 through June 2023, seasonally adjusted construction employment was above its pre-pandemic peak of 7.6 million.
In October 2021, residential construction employment moved above its pre-pandemic peak, while nonresidential construction employment only recently did so in February 2023. June 2023 seasonally adjusted residential payroll construction employment was 308,000 above its pre-pandemic peak while nonresidential payroll construction employment was 28,000 above its pre-pandemic peak.

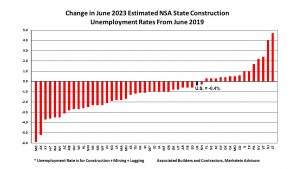
In June 2023, 35 states had lower construction unemployment rates compared to June 2019 (pre-pandemic) and 15 states had higher rates.
“Construction activity and employment has been surprisingly strong in the face of higher interest rates. Residential construction employment has been aided by home builders catching up with their projects and increased demand for new homes due to the low inventory of existing homes for sale. Meanwhile, nonresidential construction activity and employment are rising, stimulated by funding and tax incentives for manufacturers, states and localities from federal programs such as the CHIPS Act and the Infrastructure Investment and Jobs Act,” said Bernard Markstein, president and chief economist of Markstein Advisors, who conducted the analysis for ABC. “However, recent and possible future increases in the Federal Reserve’s target federal funds rate and various lenders tightening standards for commercial construction projects are a headwind for future construction projects and employment.”
Recent Month-to-Month Fluctuations
National and state unemployment rates are best evaluated on a year-over-year basis because these industry-specific rates are not seasonally adjusted. However, due to the decline in the adverse effects on the economy from the COVID-19 pandemic, high and rising interest rates and other national and international occurrences, month-to-month comparisons offer insight into the rapidly shifting economic environment for construction employment.
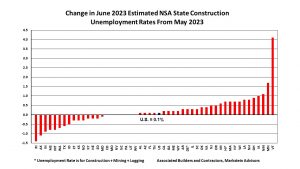
In June 2023, 15 states had lower estimated construction unemployment rates than in May, 28 states had higher rates and seven had the same rate.
The Top Five States
The five states with the lowest estimated NSA construction unemployment rates June 2023 (seven states due to ties in the rates) were:
1. Maryland, 0.4%
2. North Dakota, 0.6%
3. Maine and Wyoming (tie), 1%
5. Montana, South Dakota and Utah (tie), 1.1%
Maryland posted its lowest June NSA estimated construction unemployment rate on record. North Dakota attained its second lowest June construction unemployment rate. Maine, Montana, Utah and Wyoming all had their lowest June construction unemployment rate on record. South Dakota had its second lowest construction unemployment rate over the past seven years (since June 2016), behind last year’s 0.6% rate.
The Bottom Five States
The five states with the highest June 2023 estimated NSA construction unemployment rates were (note that Hawaii’s unemployment rate is for construction plus mining plus logging):
46. Hawaii, 5.7%
47. Nevada, 5.9%
48. New Jersey, 6.4%
49. Rhode Island, 7.1%
50. Connecticut, 7.5%
Rhode Island had the largest monthly decline in its rate (down 1.4%).
Click here to view graphs of overall unemployment rates (Tab 1) and construction unemployment rates (Tab 2) showing the impact of the COVID-19 pandemic, including a graphing tool that creates a chart for multiple states. To better understand the basis for calculating unemployment rates and what they measure, check out the Background on State Construction Unemployment Rates.